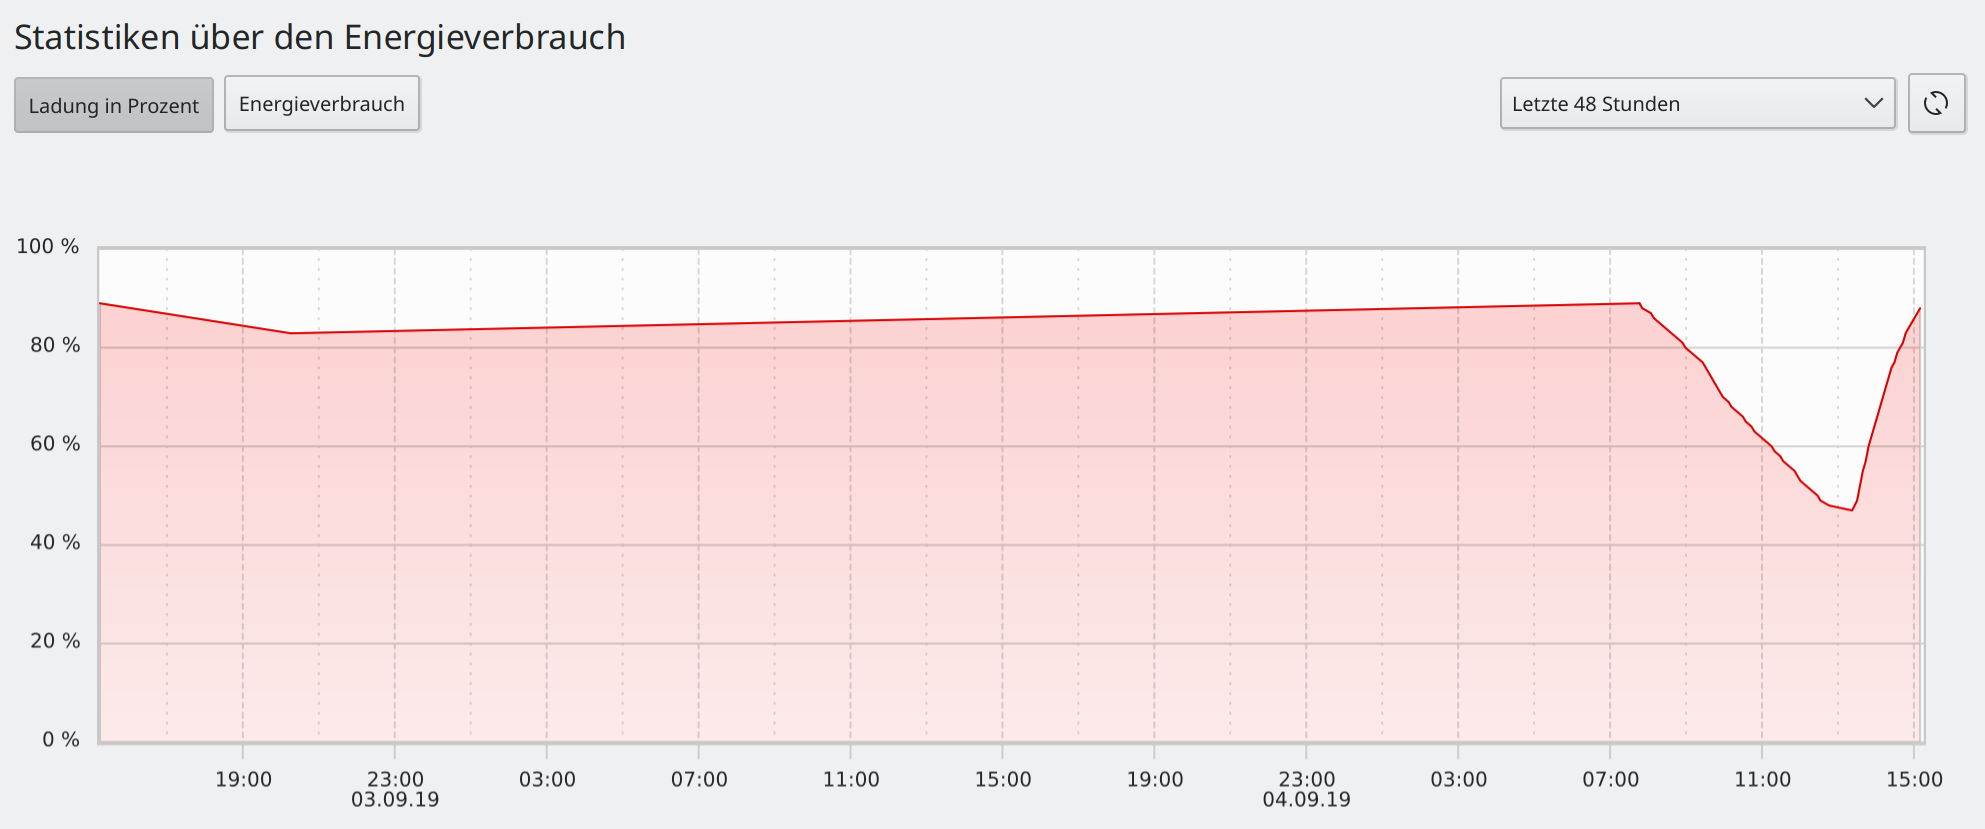
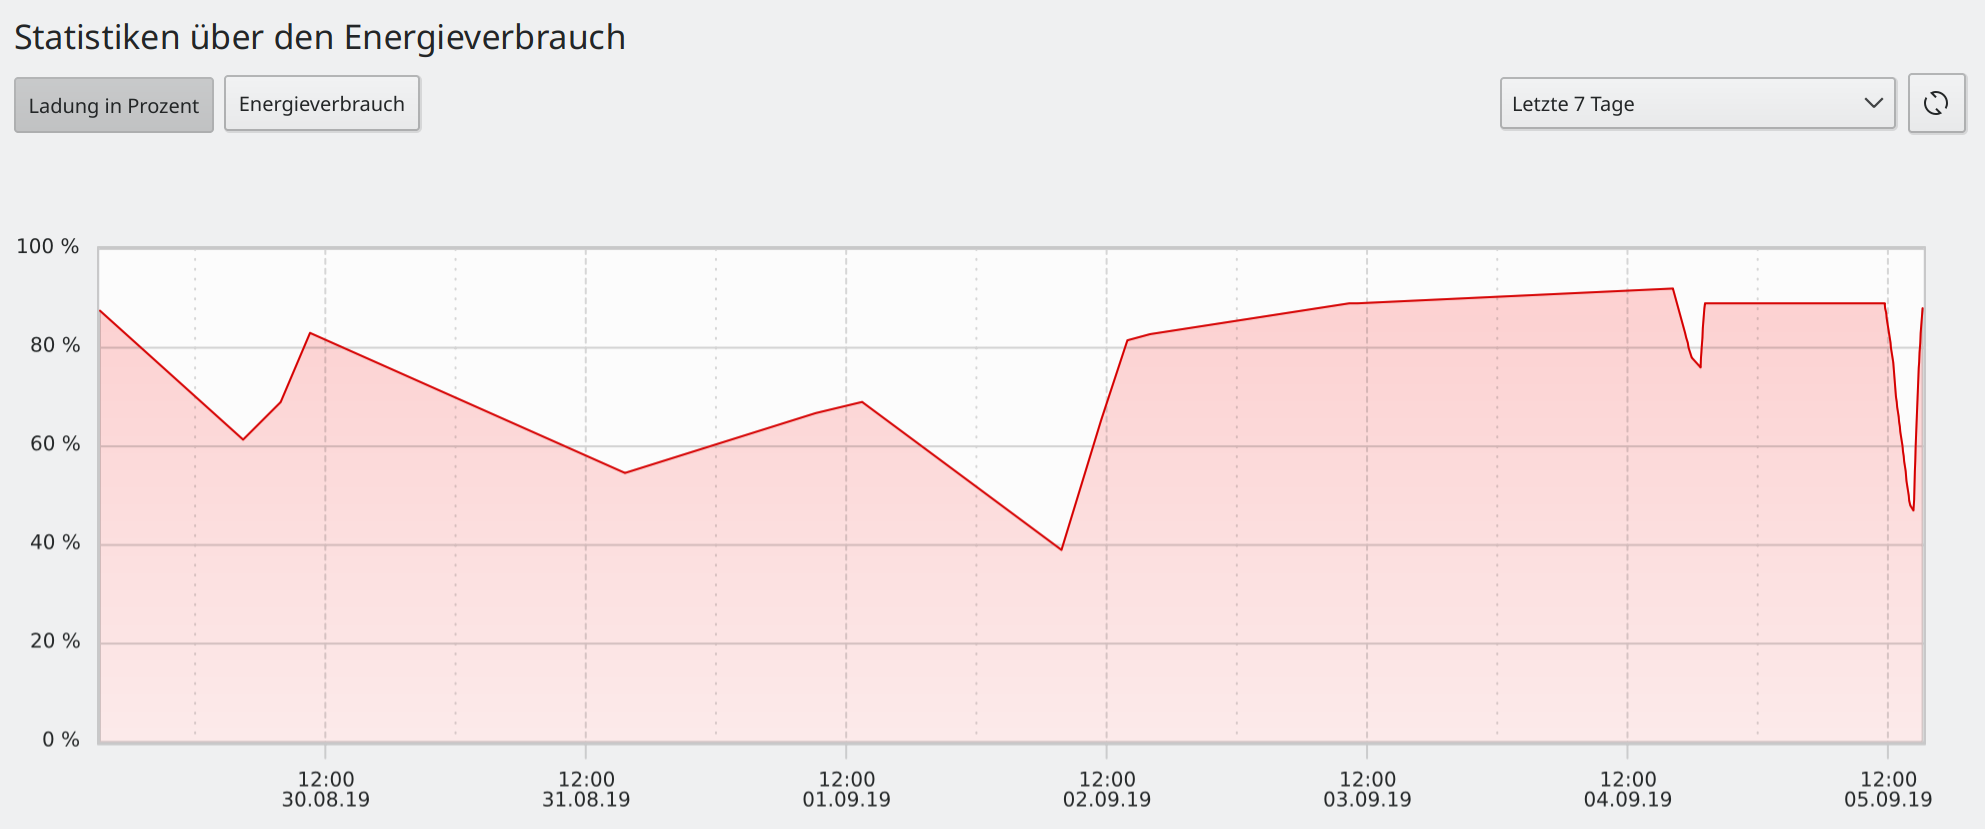
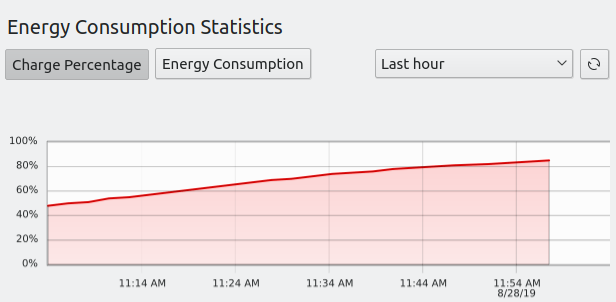
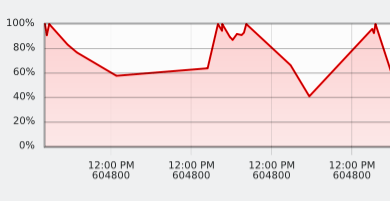
The current energy plot does not display any time line. This patch adds a grid and time stamps to the X axis.
It is assumed that the X axis of the plot ranges over [Now - Timespan, Now].
The timestamps for the timespans greater than "1 hour" are aligned to either half hours or full hours.
The resolution respectively the divisions count or number of ticks is made dependend on the timespan.
Dates are only shown if the date changes in the timespan.
If there are more or equal 10 divisions, only every second grid line gets a label to avoid that
the labels pile up, when the window size becomes small.
This patch may be only of temporary nature until kf5quickcharts becomes production ready.
BUG: 376940
FIXED-IN: 5.17.0
As QML was absolutely new to me, I am looking forward to your review.