Related Objects
Related Objects
- Mentioned Here
- T14939: Import R data
Comment Actions
TODO:
- Code cleanup:
- similarly to Symbol and SymbolWidget, introduce central classes also for line and filling properties to reduce the amount of code duplication in XYCurve, BoxPlot, Histogram, Plot, Worksheet.
- Expose 2D-structure in CAS as Matrix and allow to plot the columns of it
- Import data from .xls and .xlsx files (https://wiki.qt.io/Handling_Microsoft_Excel_file_format)
- Import R data T14939
- Barplots* (single, grouped and stacked), lollipop plots, dot plots and auto assignment of colors to plots
- Multiple regression analysis and logistic regression (https://www.evanmiller.org/linear-regression-for-fun-and-profit.html)
- support for categorical variables
- Pivot tables and data filters (https://www.youtube.com/watch?v=9SlNfuIAHyo)
- Exponential forecasting/smoothing (https://otexts.com/fpp2/expsmooth.html, https://journals.plos.org/plosone/article/figure?id=10.1371/journal.pone.0231236.g002)
- Bootstrap/Jackknife confidence intervals for estimated quantities, regression outcomes etc.
- LOESS and LOWESS smoothing
- Enable richt-text and markdown formatting in the project comment field. Project's comment is consumed not only in the properties widgets of the project but also in the Examples Dialog and later on the welcome screen (user's recently used projects will be shown, thumbnail + comment) and it would be great to have more formatting options to better structure the description text.
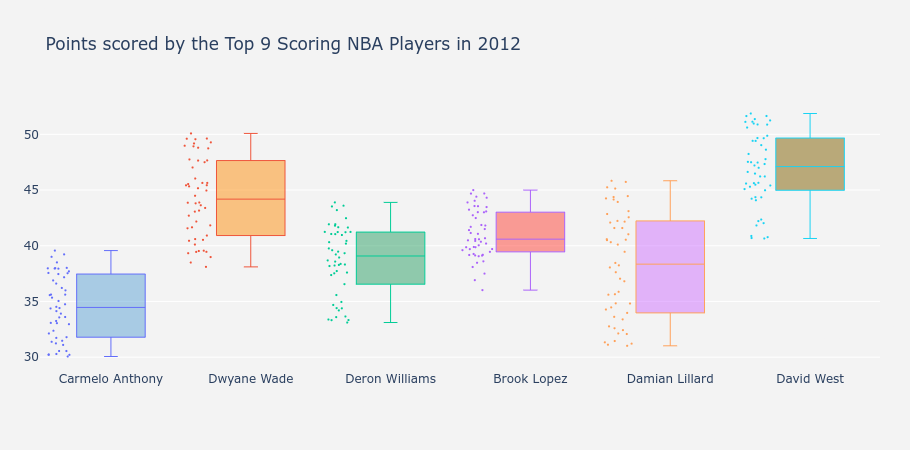
- BoxPlot:
- boxplot-offset,
- plot area width for markers (to make it independent of boxplots' width)

Comment Actions
Some of the features were implemented in 2.10. The remaining are tracked now in https://invent.kde.org/education/labplot/-/issues/218.