Calculate the list of keys of a hash table is quite expensive.
It is cheaper to keep that list and change it when a view is created or removed.
Details
Details
- Reviewers
cullmann mwolff - Group Reviewers
Kate - Commits
- R39:90157a222b5e: optimization of KTextEditor::DocumentPrivate::views()
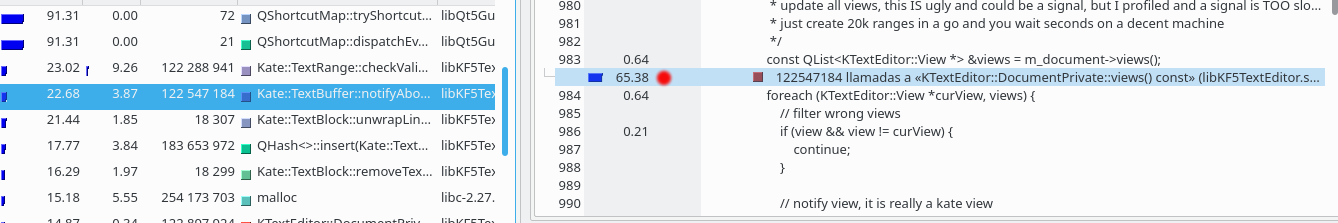
Run kwrite and paste a relative long text several times and then undo until the text is empty, with only one view.
Before:
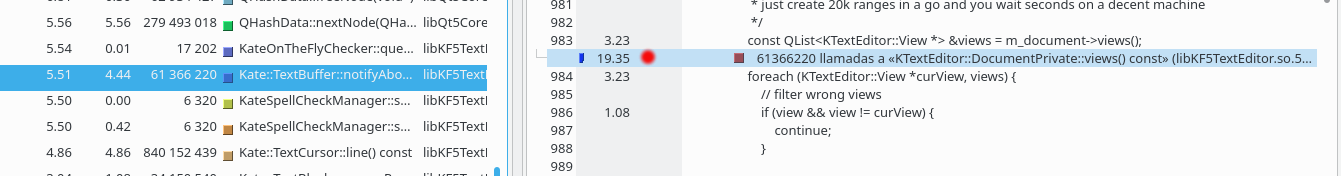
After:
Diff Detail
Diff Detail
- Repository
- R39 KTextEditor
- Lint
Automatic diff as part of commit; lint not applicable. - Unit
Automatic diff as part of commit; unit tests not applicable.
Comment Actions
If you have benchmark results for that, I have no issues with the idea.
Thought I think you only need to update the cache in add/removeView, not in KTextEditor::DocumentPrivate::createView
Comment Actions
Oh and again: please start using perf/hotspot instead of callgrind. Really, the performance numbers you get from callgrind are just *instructions*! It doesn't mean "65% of CPU". It means 65% of the instructions.
You are doing such good work with profiling and optimizing software, it would be so much better if you'd use the correct tools too!
Comment Actions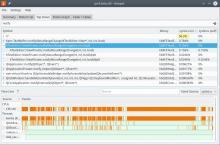
After: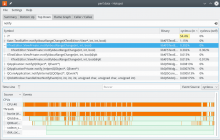
Add and remove from the list.
About the tools I use to profile:
- I'm used to use slow machines, I have no problems running under valgrind.
- When I can run a program and I'm able to repeat the workload that produces high cpu usage or slowness, I do like to use callgrind/kcachegrind, just because I get inclusive costs.
- When a program gets slow after some time running or under some unexpected circumstances, yes I use perf, because I do not need to restart the program and I can do live measurements.
- But I do love the kcachegrind view of the % of instructions for every method within the source code.
In any case, the hotspot results pasting 10 times and undoing:
Before:
After:

Comment Actions
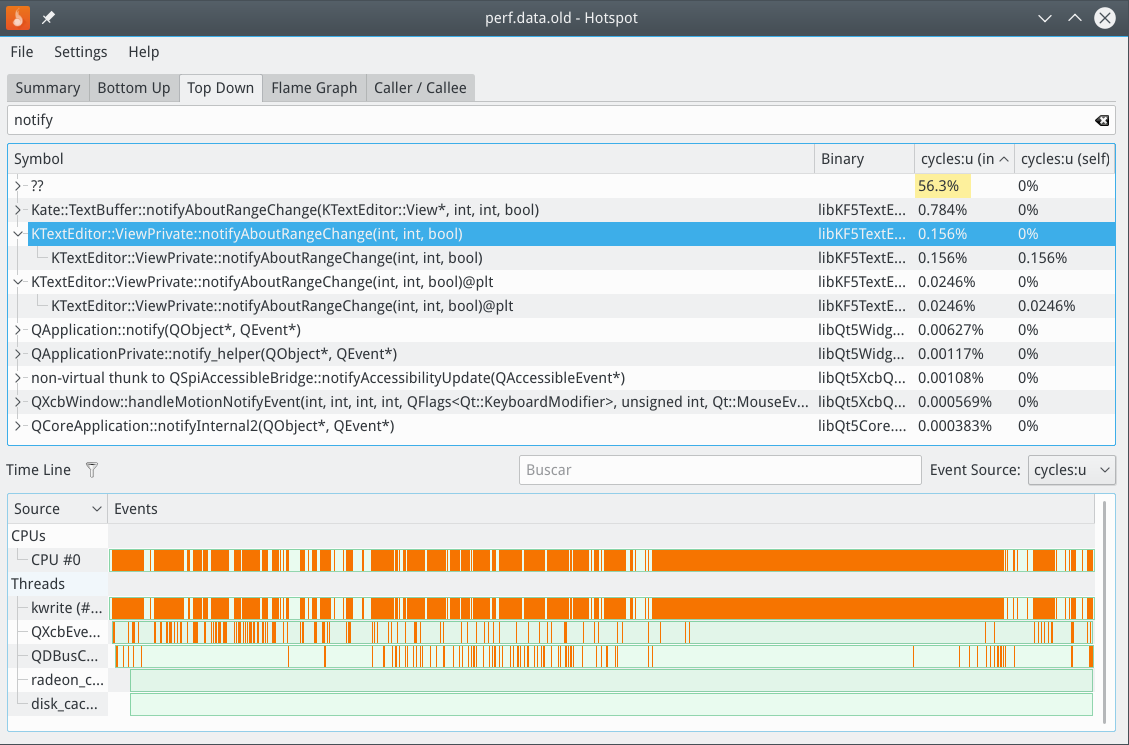
But the hotspot screenshot clearly shows that you are spending time on optimizing things that are barely noticeable. You have optimized a function that consumes 0.3% of the CPU cycles. It now consumes only ~0.15%, at the cost of slightly higher memory consumption.
This is the real cost. The instruction numbers reported by callgrind paint a very different picture (22.6% vs. 5.5%). But that's not what actually matters, the cycle cost is way more important.
Also note that hotspot shows inclusive costs. You should get used to it, most notably have a look at the flamegraph and get acquainted with that way to visualize profiling costs.
Comment Actions
Actually, no. Ignore what I said. The pictures you are showing are pretty meaningless. Did you run perf with --call-graph dwarf? Better look at the flamegraph and search for the function you are interested in (Kate::TextBuffer::notifyAboutRangeChange) or use the Caller/Callee view to get an aggregated view of your change.
Comment Actions
 .
.
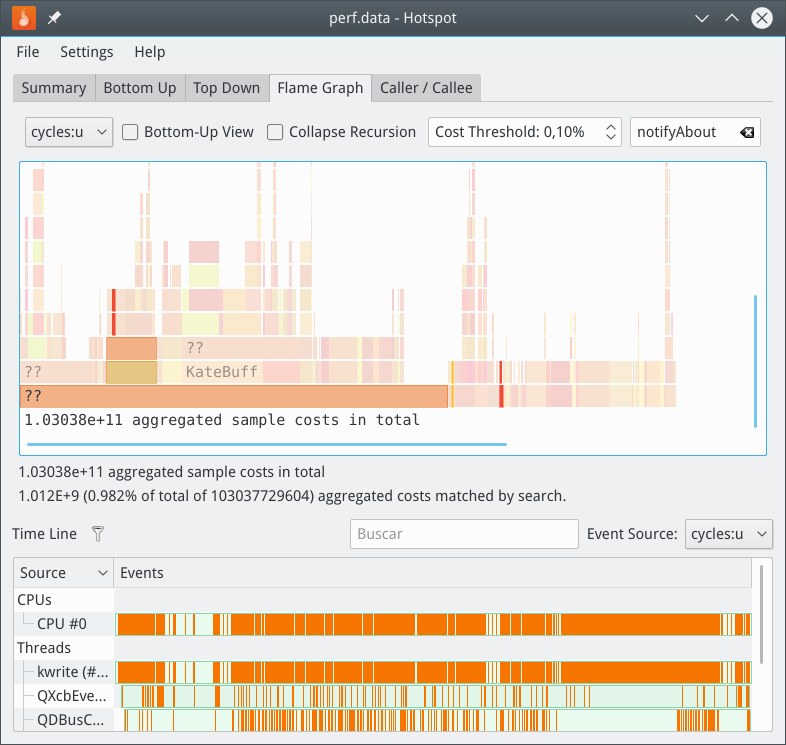
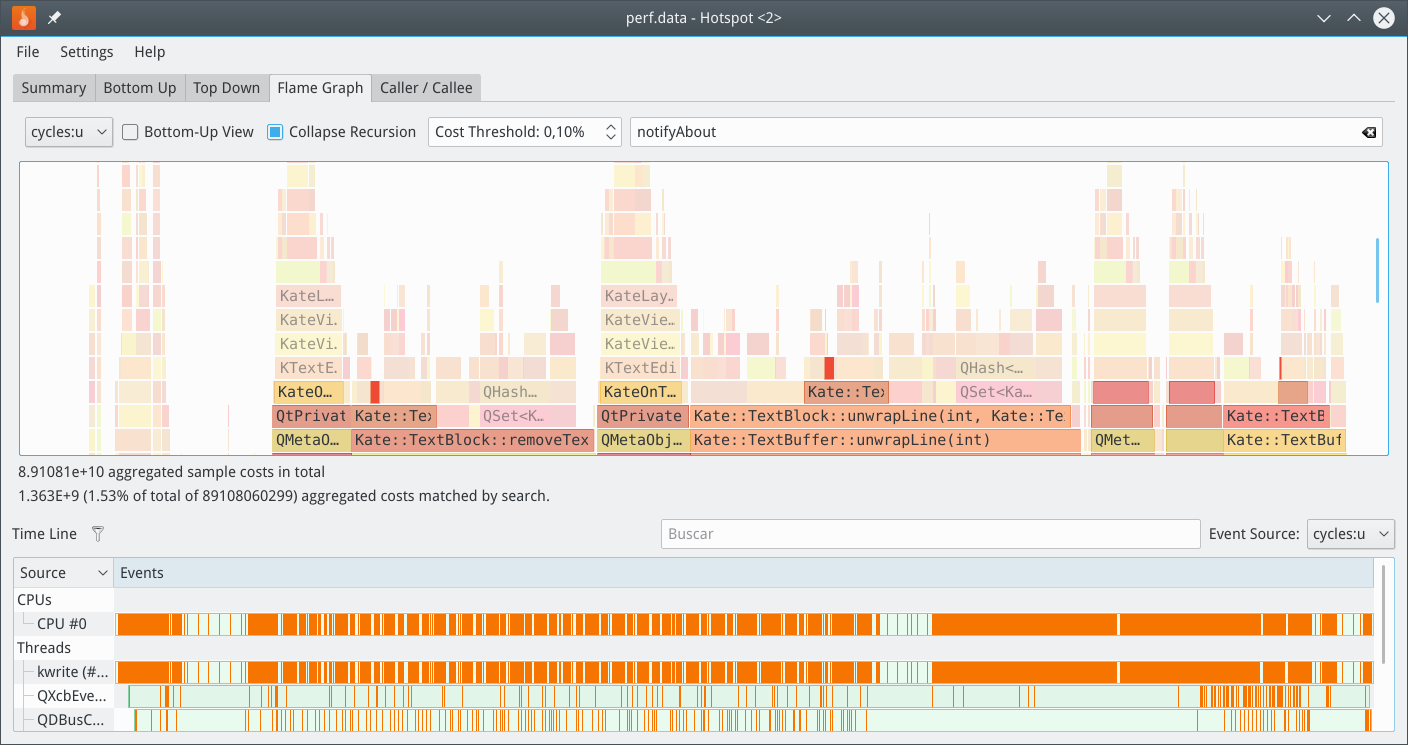
The same test (pasting 25 times and undoing) with --call-graph dwarf with this result: , and
, and  .
.
That's not the impression I got running kwrite in live and under a slow machine (valgrind), before I had to wait for the paste to finish, and after the patch not. But kwrite is still slow undoing the paste.
I did run perf record -g, the same test with the patch applied after pasting the text 25 times and undoing with this result:
The same test (pasting 25 times and undoing) with --call-graph dwarf with this result:

Comment Actions
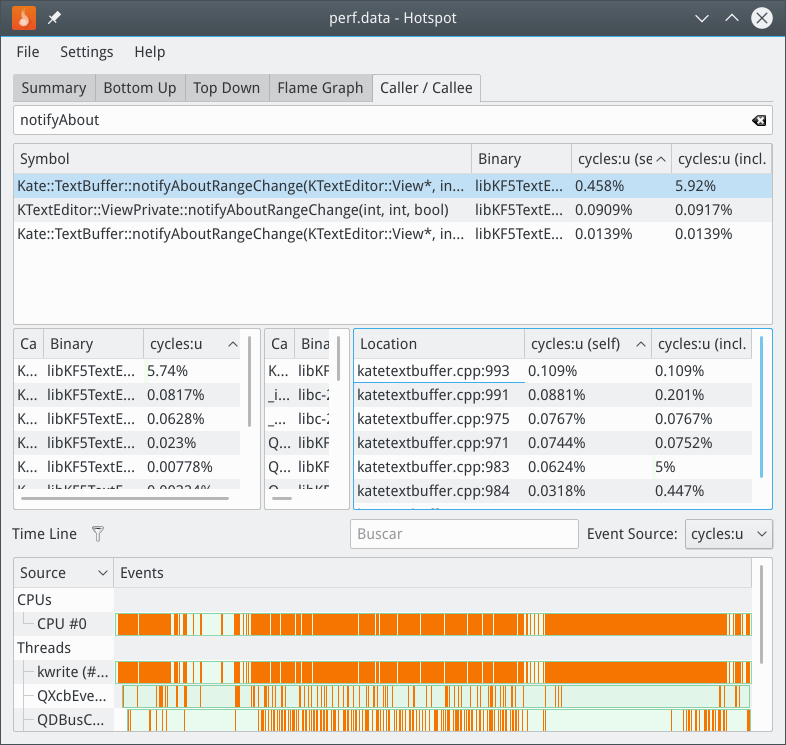
perf record -g produces unusable data files, since it relies on the frame pointer which is usually not available. Use perf record --call-graph dwarf instead. https://phabricator.kde.org/file/data/w4qogv4brtxlc5p5bnwr/PHID-FILE-q62giymcptudpl5m6bt3/kwrite_perf_after_25_dwarf_caller.png shows ~1.5% in notifyAboutRangeChange (inclusively). Is that before or after your patch here?
Comment Actions
OK, cool! That clearly shows that this patch _is_ valuable: Before we have ~6% CPU cycle cost, now it's down to 1.5% (inclusively). This is a significant reduction, so I'm all for it.
But note once again the stark difference in these numbers vs. what valgrind reports. Please, try to use perf record --call-graph dwarf + hotspot flamegraphs more in favor of callgrind/kcachegrind. Note that you can even use hotspot's record page for some more features, most notably the off-CPU profiling. This can give you more food for potential optimizations (finding sleep time, I/O, lock contention, ...).
Happy profiling!