Fix ordinate axis labels when zooming
ClosedPublic

Authored by rszczesiak on Apr 28 2020, 1:18 PM.

Details

Summary

If i understand the intent of the author correctly, the sole purpose of KReportChartView::slotNeedUpdate() was one-time customization of ordinate axis labels at the time of chart creation. The fact that signal is disconnected immediately after execution of slot starts seems to confirm my understanding.

The problem begins when one zooms the chart (using so-called rubber band zooming feature from KDiagram project). Axis ticks and labels are recalculated but still they are overridden with "hard labels" defined in the slot body. The number of axis ticks increases and is grater than the number of hard labels, so the labels are repeated in cycle. In and of itself it is really a feature rather than a bug but the feature works to our disadvantage in this case.
Please find below a quote from AbstractAxis Class documentation:

void AbstractAxis::setLabels( const QStringList & list )
Use this to specify your own set of strings, to be used as axis labels.
Labels specified via setLabels take precedence: If a non-empty list is passed, KD Chart will use these strings as axis labels, instead of calculating them.
If you pass a smaller number of strings than the number of labels drawn at this axis, KD Chart will repeat the strings until all labels are drawn. As an example you could specify the seven days of the week as abscissa labels, which would be repeatedly used then.

Unfortunately, mere removal of disconnect method call does not solve the problem but the same documentation provides a way to customize axis labels when needed. It is done through overriding of const QString AbstractAxis::customizedLabel( const QString & label ) const

My solution proposed in attached patch goes this way and also simplifies calculations where they seemed over-complicated to me. Please correct my understanding if i missed the point of removed lines.

Please find attached screenshots before and after the fix.
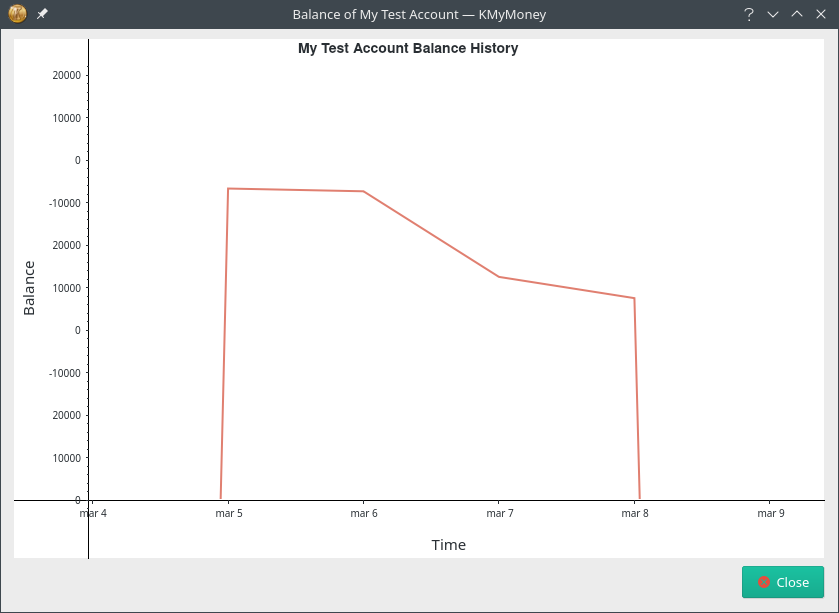
Balance history chart before fix with no zoom:


Balance history chart before fix with zoom::

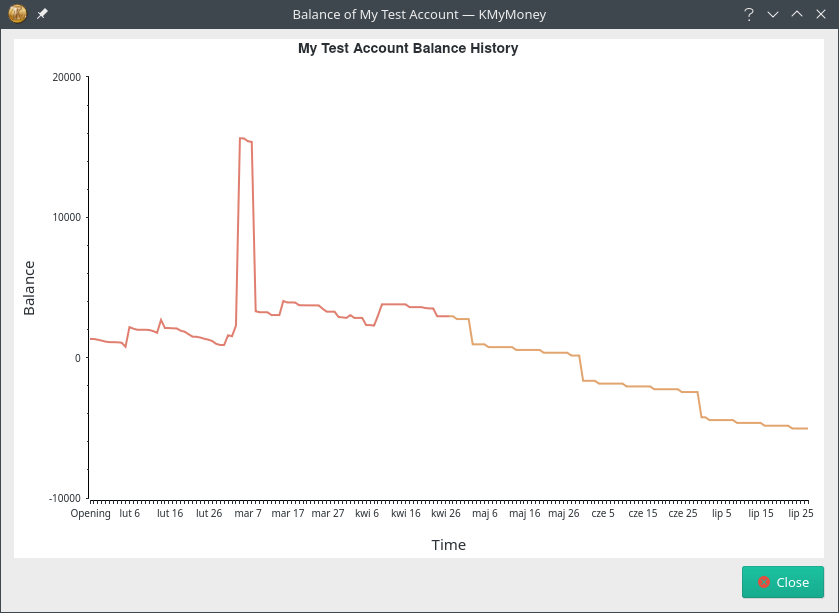
Balance history chart after fix with no zoom:

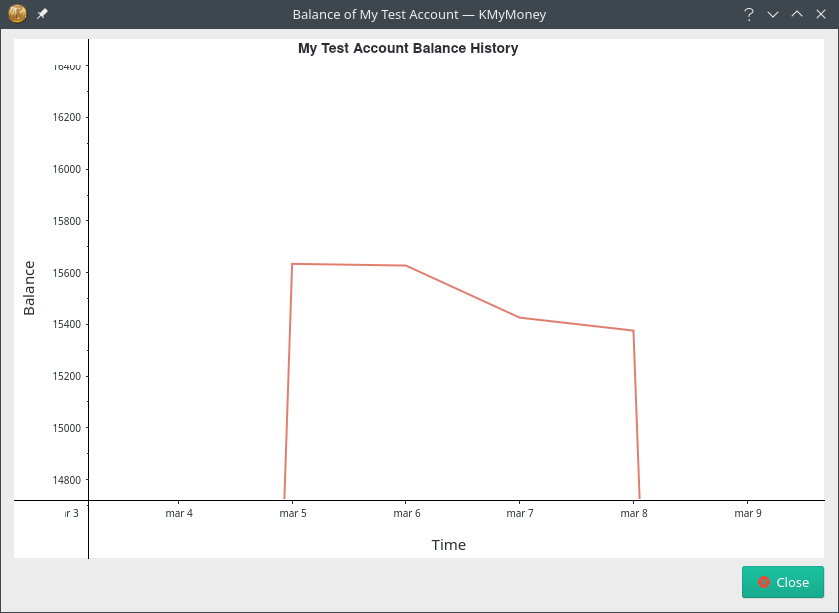
Balance history chart after fix with zoom::

As a footnote, I would like to sincerely thank to all the people who have contributed to this project. I started to use KMyMoney recently and I am surprised how good it is, especially for an open-source project run by the community. It suits my need for personal finance and investment-supporting software amazingly well. If you find my contribution valuable, I would love to provide more patches in the future if I find more bugs or feel that some feature is missing. In fact, I have little to no industrial experience in C++ as I work mostly in Java. Please let me know if I broke any C++ coding rules.

Diff Detail

Repository
R261 KMyMoney
Lint
Automatic diff as part of commit; lint not applicable.
Unit
Automatic diff as part of commit; unit tests not applicable.
rszczesiak requested review of this revision.Apr 28 2020, 1:18 PM
rszczesiak created this revision.
rszczesiak edited the test plan for this revision. (Show Details)Apr 28 2020, 1:51 PM
rszczesiak edited the summary of this revision. (Show Details)Apr 28 2020, 2:09 PM
rszczesiak edited the test plan for this revision. (Show Details)
tbaumgart requested changes to this revision.Apr 28 2020, 6:48 PM
tbaumgart added a subscriber: tbaumgart.

This in general is a high quality patch. Thanks much. The changes I suggest are minor details.

kmymoney/plugins/views/reports/core/kreportcartesianaxis.cpp
46

I would use const auto instead of QChar in the above two statements.

50

Defining const qreal labelValue makes sure that labelValue is not changed. But that is a minor detail.

kmymoney/plugins/views/reports/core/kreportcartesianaxis.h
19

Please change into KREPORTCARTESIANAXIS_H because the filename also does not include underscores

40

Pass locale as const QLocale&. No need to pass the full object on the stack here., a reference is enough since we don't change it anyway.

42

Returning a const QString does not make sense, remove const.

This revision now requires changes to proceed.Apr 28 2020, 6:48 PM
rszczesiak marked 3 inline comments as done.Apr 28 2020, 9:18 PM
rszczesiak added inline comments.
kmymoney/plugins/views/reports/core/kreportcartesianaxis.h
40

I tried to do it this way but either I lack understanding of C++ or it cannot be easily done. Here is how I understand the issue. If I get it wrong I would appreciate your explanation. I change the constructor to let locale be passed by reference and I run the application in Debug with a Breakpoint at the beginning of customizedLabel method. I create a new Balance History Chart and check the value of m_locale reference variable every time the program stops at the Breakpoint. For the first about 20 times m_locale refers to a valid object. I also check the Stack and I see a method of KReportChartView class there. Then, after the first about 20 stops at the Breakpoint, I see that m_locale refers to some garbage in the memory and there is no more any method of KReportChartView class on the Stack. Why there is so many calls to customizedLabel? It has tobe some Chart component objects require update. Now, why after a short while m_locale points to garbage and label customization fails? I think it has to do with KReportChartView lifecycle reaching the end as soon as the chart is first created with the locale object being killed in the same time. It might be that QWidget::~QWidget() is responsible for that. From documentation:

Destroys the widget.

All this widget's children are deleted first. The application exits if this widget is the main widget.

When the Chart is refreshed after original creation, application fails because m_locale reference variable is now invalid.

42

Unfortunately, superclass' method that is overridden here is declared as virtual const QString customizedLabel( const QString& label ) const;. Therefore, removing the const keyword before return type causes compiler error.

rszczesiak updated this revision to Diff 81478.EditedApr 28 2020, 9:20 PM

Uploaded a new diff patch after changes according to @tbaumgart's comments.

tbaumgart accepted this revision.Apr 29 2020, 4:45 PM

Looks good to me.

kmymoney/plugins/views/reports/core/kreportcartesianaxis.h
40

I tried to duplicate this here. Using the reference in the ctor was no problem at all. Tried debug and release version. No problem whatsoever. So this might also depend on the compiler and Qt version you use. The code looks clean and since this is only called once during the creation of the view we might as well leave it the way it works for you.

42

That's fine. I did not know about the base class. Leave the const then,

This revision is now accepted and ready to land.Apr 29 2020, 4:45 PM

Do we have a bug entry for this one? If not, please create one and add

BUG: ####

to the commit message.

rszczesiak updated this revision to Diff 81549.Apr 29 2020, 7:44 PM

Thank you, @tbaumgart for your time spent reviewing my changes. I have amended my commit message with tag "BUG: 420767"

rszczesiak updated this revision to Diff 81552.Apr 29 2020, 8:04 PM
rszczesiak added inline comments.Apr 29 2020, 8:12 PM
kmymoney/plugins/views/reports/core/kreportcartesianaxis.h
40

Thank you for your time spent trying to reproduce my issue. Your failure to reproduce it made me think it over. It turns out it was my mistake because I not only changed c'tor declaration from explicit KReportCartesianAxis( QLocale locale, int precision, KChart::AbstractCartesianDiagram* diagram = nullptr ) to explicit KReportCartesianAxis( const QLocale& locale, int precision, KChart::AbstractCartesianDiagram* diagram = nullptr ) but also I changed private instance variable from QLocale m_locale to const QLocale& m_locale, what I should not have done. Sorry for the fuss.

rszczesiak updated this revision to Diff 81561.EditedApr 29 2020, 10:41 PM

There is one thing I overlooked in my previous revision. I have just tested my changes against a new account with clear history (empty ledger). It leads to a horizontal-line chart that is drawn incorrectly if no custom grid extension is made. The conclusion is the original grid extension code is here to stay. I have just moved it from void KReportChartView::slotNeedUpdate() to the bottom of void KReportChartView::drawPivotChart( ... ) and I refactored a little bit. Sorry for messing around in this already accepted patch. The good thing is labels are now printed correctly even when one zooms a horizontal-line chart :)

Still looks OK to me. Push it.

kmymoney/plugins/views/reports/core/kreportcartesianaxis.h
40

Ah, that indeed immediately explains the failing. Good you figured it out.

rszczesiak updated this revision to Diff 81564.Apr 30 2020, 7:03 AM

Also there was a todo comment in the code I have removed, so thought it to be appropriate to take care of it lest it be missed out.

/ @todo this might also need some vertical adjustment in case of a horizontal line
/ see below how this has been solved for linear graphs

Indeed, support for logarithmic axis type was required.
Now I think the code is robust and complete. Now I'll just wait for the final review from you :)

If you would rather the logarithmic axis type support for horizontal line charts be added in a separate commit, please let me know.

rszczesiak updated this revision to Diff 81566.Apr 30 2020, 7:30 AM

0.0 is quite a special argument for the logarithm. I made one last change adding support for this case.

rszczesiak updated this revision to Diff 81568.Apr 30 2020, 7:40 AM
rszczesiak updated this revision to Diff 81659.May 1 2020, 12:37 PM

I have done some more testing and I realized that precision (number of digits after the decimal point) is subject to change. In fact, account balance history chart is pretty straightforward but the code that I worked with is also used with configurable charts in reports. Precision can be changed in the Range tab of the Report Configuration window.
My previous patch created yAxis by calling new KReportCartesianAxis(loc, m_precision) whereas it should be new KReportCartesianAxis(loc, config.yLabelsPrecision()).

There is but one quirk that I cannot quite grasp. When I run the program with Debugger (no breakpoints) precision setting works like a charm. On the other hand, when I run the program without Debugger, chart labels are printed even to the fifth digit after the decimal point, ignoring the fact that precision is set to 2. Could you please check if this strange behavior also exists on your system?

rszczesiak updated this revision to Diff 81710.EditedMay 1 2020, 9:28 PM

With the priceless help from @tbaumgart I managed to find a solution. Please find attached the final version of the patch.

I do not have write permission to the repository. @tbaumgart, would you please land the patch for me?

This revision was automatically updated to reflect the committed changes.